| season | PA | AB | R | H | 1B | 2B | 3B | HR | RBI | BB | SO | SB | CS | AVG | OBP | SLG |
|---|---|---|---|---|---|---|---|---|---|---|---|---|---|---|---|---|
| 2024 | ||||||||||||||||
| 2023 | ||||||||||||||||
| 2022 | ||||||||||||||||
| 2021 | ||||||||||||||||
| 2020 | ||||||||||||||||
| 2019 | ||||||||||||||||
| 2018 | ||||||||||||||||
| 2017 |
| season | PO | A | Et | Ef | ERR | FP |
|---|---|---|---|---|---|---|
| 2024 | ||||||
| 2023 | ||||||
| 2022 | 8 | 20 | 0 | 2 | 2 | 0.933 |
| 2021 | 32 | 24 | 0 | 0 | 0 | 1.000 |
| 2020 | 25 | 25 | 0 | 1 | 1 | 0.980 |
| 2019 | 40 | 38 | 1 | 1 | 2 | 0.975 |
| 2018 | 39 | 7 | 1 | 1 | 2 | 0.958 |
| 2017 | 10 | 6 | 0 | 1 | 1 | 0.941 |
| season | G | W | L | IP | BF | ER | ERA | %FPS | K | BB | K/BB | WHIP | BAA |
|---|---|---|---|---|---|---|---|---|---|---|---|---|---|
| 2024 | .00 | .000 | |||||||||||
| 2023 | .00 | .000 | |||||||||||
| 2022 | 22 | 14 | 2 | 66.99 | 270 | 18 | 1.34 | 72.3 | 106 | 7 | 15.14 | 0.88 | .198 |
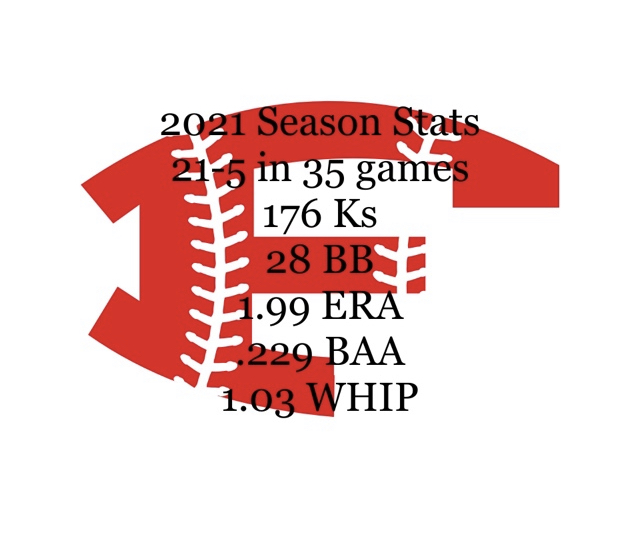
| 2021 | 20 | 5 | 2 | 44.34 | 187 | 12 | 1.35 | 72.1 | 55 | 12 | 4.58 | 1.11 | .213 |
| 2020 | 30 | 10 | 8 | 96.67 | 410 | 37 | 1.91 | 73.3 | 44 | 4 | 11.00 | 1.18 | .272 |
| 2019 | 40 | 10 | 2 | 93.32 | 388 | 29 | 1.55 | 68.5 | 62 | 14 | 4.43 | 1.19 | .261 |
| 2018 | 17 | 3 | 1 | 22.34 | 103 | 10 | 2.24 | 65.7 | 8 | 4 | 2.00 | 1.48 | .299 |
| 2017 | 7 | 3 | 1 | 8.67 | 38 | 1 | .58 | 66.7 | 6 | 0 | .00 | 1.04 | .250 |
PA: plate appearances
AB: at bats
R: runs
H: hits
1B: singles
2B: doubles
3B: triples
HR: home runs
RBI: runs batted in
BB: walks
Kc: strike out called
Ks: strike out swinging
SB: stolen bases
CS: caught stealing
AVG: batting average
OBP: on base %
SLG: slugging %
PO: put outs
A: assists
Et: throwing error
Ef: fielding error
ERR: errors
%FP: fielding percentage
G: games
W: wins
L: losses
IP: innings pitched
BF: batters faced
ER: earned runs
ERA: earned run average
%FPS: % first pitch strike
K: strikeouts
BB: walks
K/BB: strikeouts-to-walks ratio
BAA: batting average against